In this post, Reddit user u/FlyingCow313 shows an image that resulted from thier attempt to implement a Mandlebrot renderer.

In this notebook we are going to recreate the pattern and investigate how it is generated.
First, lets create a working Mandlebrot renderer, then we will try to mess with it to recreate the effect.
Note: I have adapted basic generation and rendering code from this and this.
import numpy as np
import matplotlib.pyplot as plt
%matplotlib inline
def create_mandlebrot(
    n = 700, # screen size pixels

    s = 1,  # Scale.
    p = 0.6 + 0j, # screen offset

    horizon = 2.0 ** 20,
    iterations=500
):

    s = int(s * n * 4 / 7) # maps scale factor to pixel space
    x = np.linspace(-n / s, n / s, num=n).reshape((1, n))
    y = np.linspace(-n / s, n / s, num=n).reshape((n, 1))

    Z = np.tile(x, (n, 1)) + 1j * np.tile(y, (1, n)) - p
    C = Z.copy()

    M = np.full((n, n), True, dtype=bool)
    N = np.zeros((n, n))

    log_horizon = np.log(np.log(horizon))/np.log(2)

    for i in range(iterations):
        Z[M] = Z[M] * Z[M] + C[M]
        M[np.abs(Z) > horizon] = False
        N[M] = i - np.log(np.log(np.abs(Z[M]) + 1))/np.log(2) + log_horizon

    return N
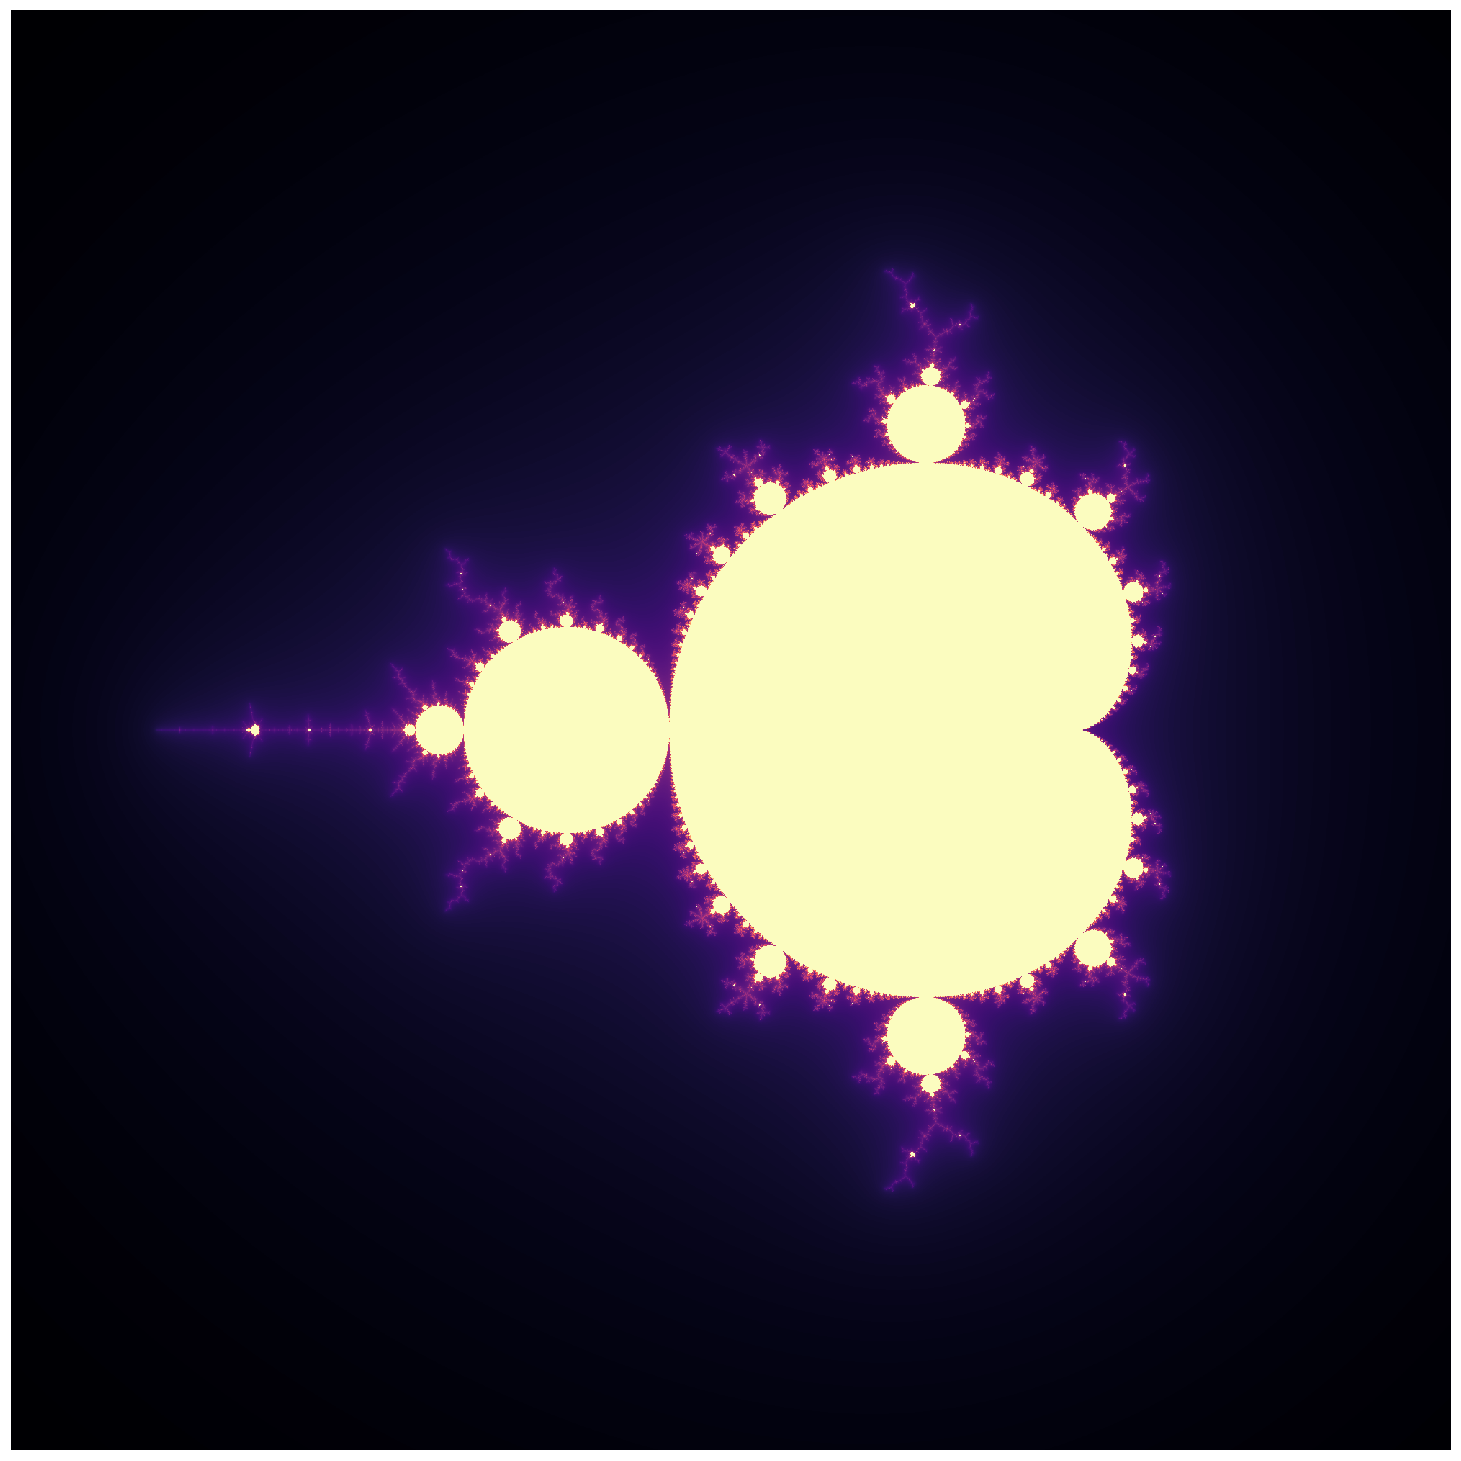
N = create_mandlebrot(n=2000, iterations=2000)
fig = plt.figure(figsize=(20, 20))
ax = fig.add_axes([0, 0, 1, 1], frameon=False, aspect=1)
ax.set_xticks([])
ax.set_yticks([])
plt.imshow(np.flipud(np.log(1 + N)), cmap='magma');
Recreating the Effect
The key error is in the following code snippet (from this file):
    while comparative(z, '2500+2500i', '<') > 1 and comparative(z, '-2500-2500i', '>') > 1 and loops < 500:
        z = comp(comp(str(z), str(z), 'times'), str(r/100)+'+'+str(f/100)+'i', 'add')
        loops += 1
    if comparative(z, '1000+1000i', '<') > 1:
        return 'black'
    else:
        return 'white'
The comparative function takes two strings representing complex numbers and a third representing the comparative operator. Internally, for complex arguments a + bi and x + iy, and comparative operator op, it returns true if and only if (a op b) and (b op y). Therefore the condition comparative(z, '2500+2500i', '<') is only true if the imaginary and real components of z are less than 2500.
In normal Mandelbrot rendering our terminal condition is based upon the magnitude of z, whereas in this situation the iteration stops when z enters into one of the two boxes [(2500, 2500), (\infty, \infty)] or [(-2500, -2500), (-\infty, -\infty)].
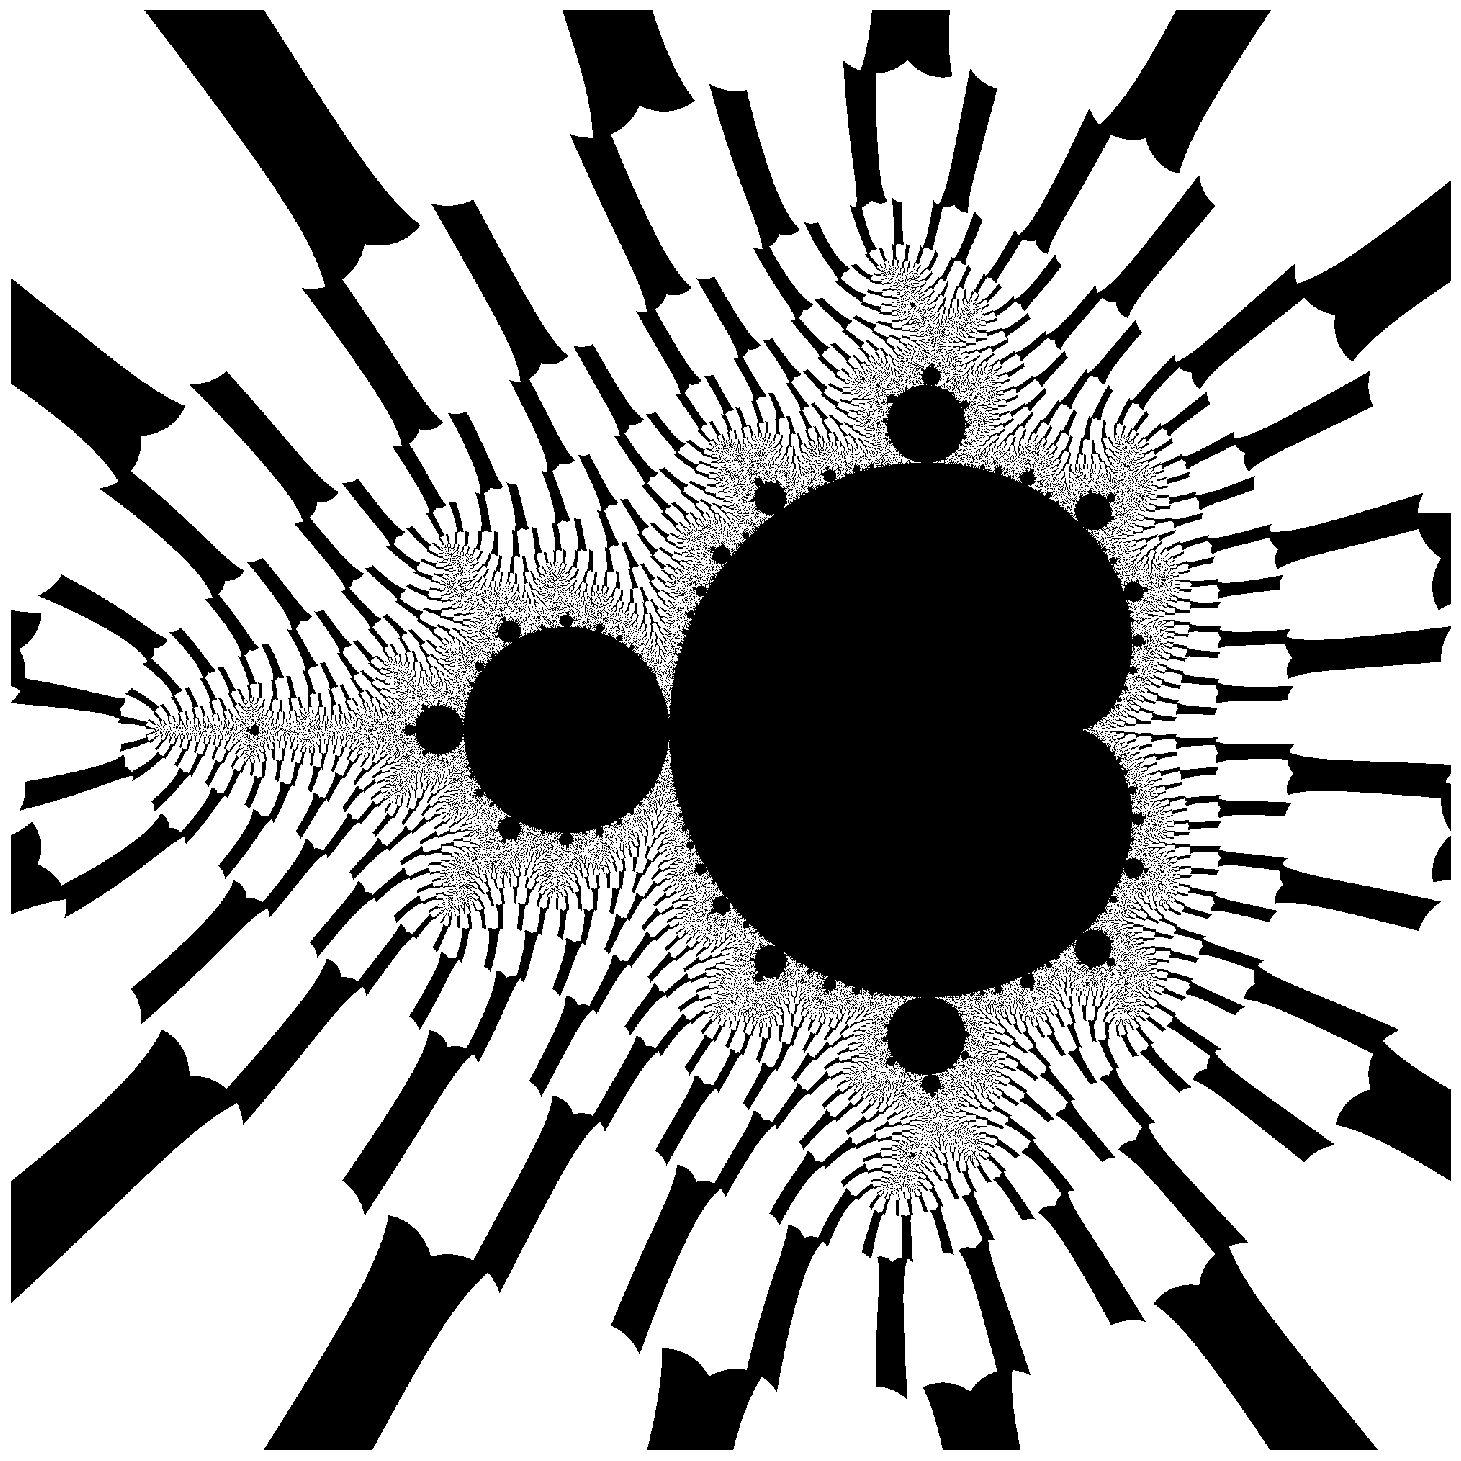
def create_mandlebrot_pillars(
    n = 700, # screen size pixels

    s = 1,  # Scale.
    p = 0.6 + 0j, # screen offset

    iterations=500
):

    s *= n * 4 / 7 # maps scale factor to pixel space
    x = np.linspace(-n / s, n / s, num=n).reshape((1, n))
    y = np.linspace(-n / s, n / s, num=n).reshape((n, 1))
    Z = np.tile(x, (n, 1)) + 1j * np.tile(y, (1, n)) - p

    C = Z.copy()
    M = np.full((n, n), False, dtype=bool)
    N = np.zeros((n, n))

    for i in range(iterations):
        Z[M] = Z[M] * Z[M] + C[M]
        M = (
            ((Z.imag < 2500) & (Z.real < 2500)) &
            ((Z.imag > -2500) & (Z.real > -2500))
        )

    M = (Z.imag < 1000) & (Z.real < 1000)
    return ~M
N = create_mandlebrot_pillars(iterations=500, n=2000)
fig = plt.figure(figsize=(20, 20))
ax = fig.add_axes([0, 0, 1, 1], frameon=False, aspect=1)
ax.set_xticks([]); ax.set_yticks([])
plt.imshow(np.flipud(N), cmap='gray');
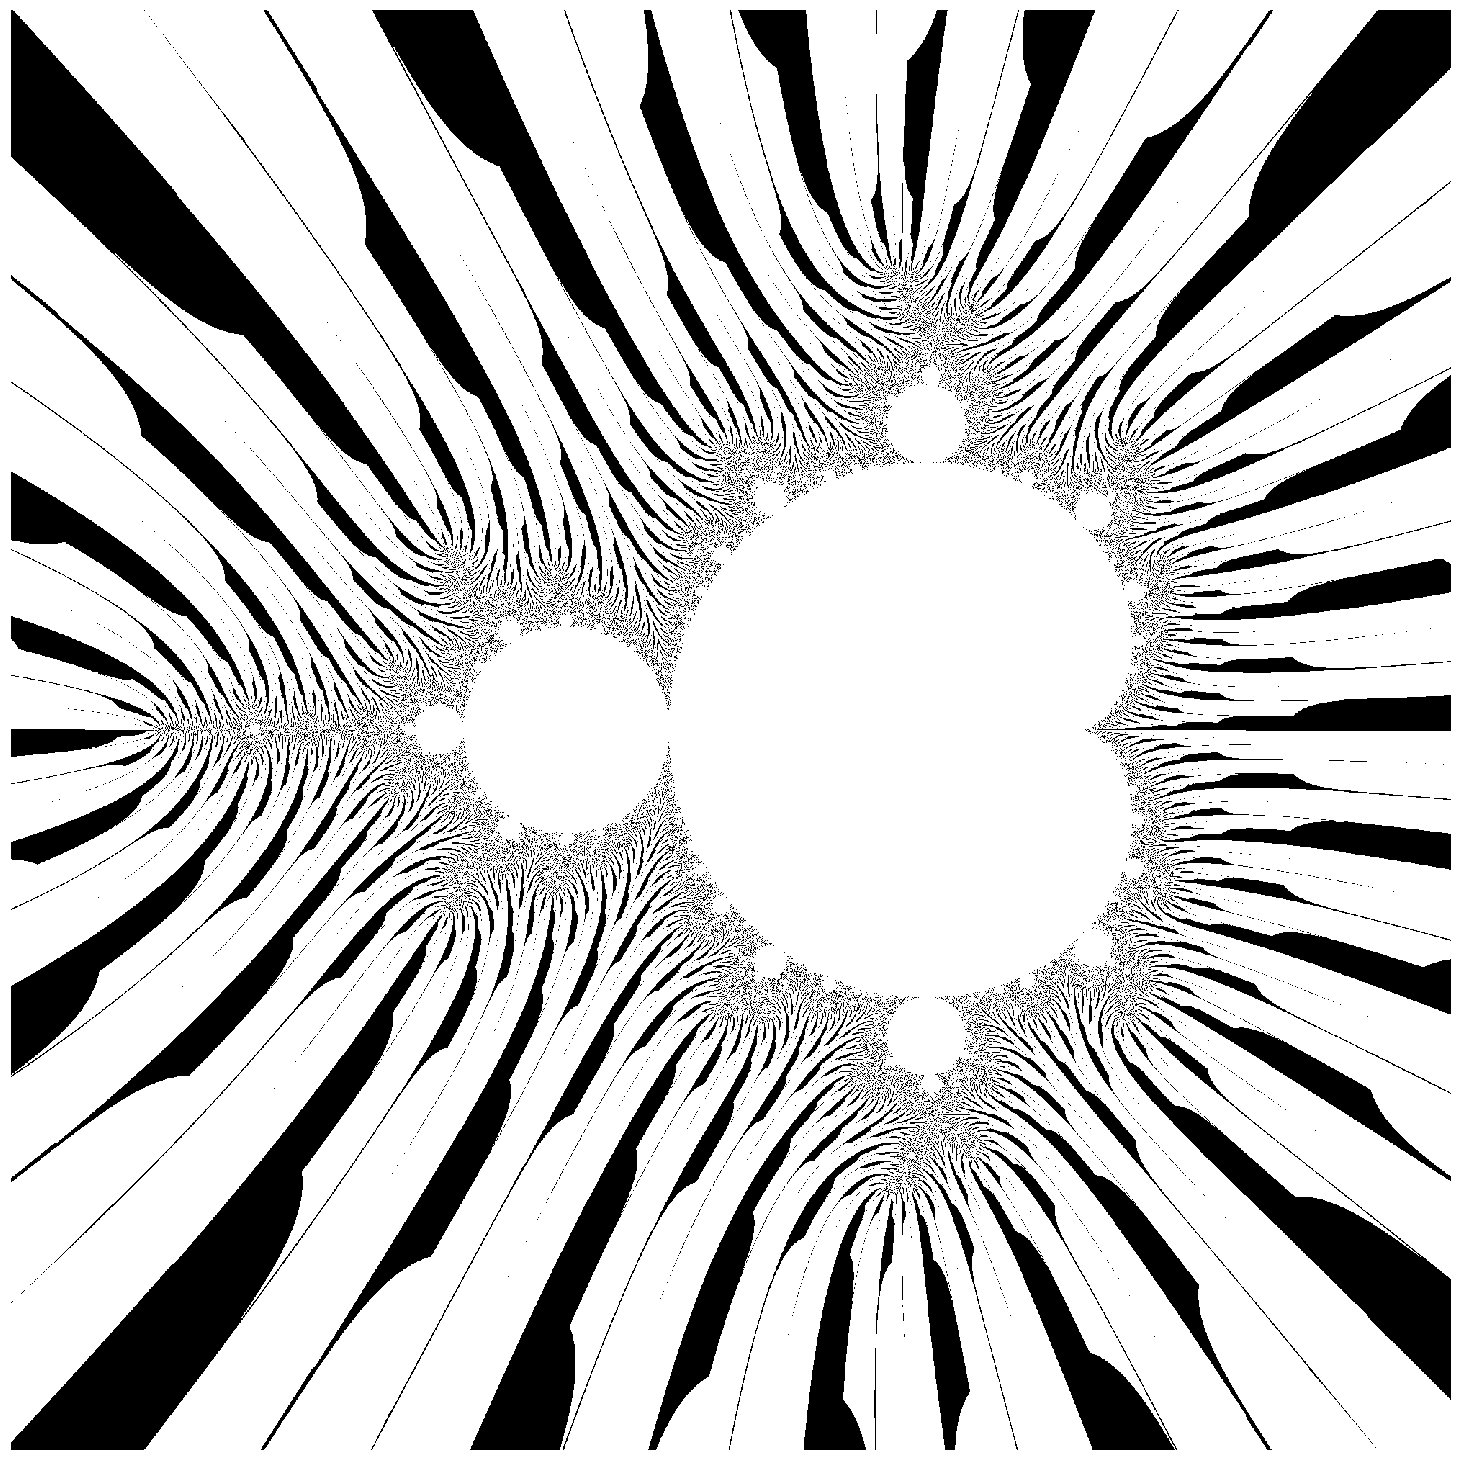
def create_mandlebrot_zebra(
    n = 700, # screen size pixels

    s = 1,  # Scale.
    p = 0.6 + 0j, # screen offset

    iterations=500
):

    s *= n * 4 / 7 # maps scale factor to pixel space
    x = np.linspace(-n / s, n / s, num=n).reshape((1, n))
    y = np.linspace(-n / s, n / s, num=n).reshape((n, 1))
    Z = np.tile(x, (n, 1)) + 1j * np.tile(y, (1, n)) - p

    C = Z.copy()
    M = np.full((n, n), False, dtype=bool)
    N = np.zeros((n, n))

    for i in range(iterations):
        Z[~M] = Z[~M] * Z[~M] + C[~M]
        M = (
            ((Z.imag > 2500) & (Z.real > 2500)) |
            ((Z.imag < -2500) & (Z.real < -2500))
        )

    M = (Z.imag < 1000) & (Z.real < 1000)
    return M
N = create_mandlebrot_zebra(iterations=500, n=2000)
fig = plt.figure(figsize=(20, 20))
ax = fig.add_axes([0, 0, 1, 1], frameon=False, aspect=1)
ax.set_xticks([]); ax.set_yticks([])
plt.imshow(np.flipud(N), cmap='gray');
def create_mandlebrot_with_angles(
    n = 700, # screen size pixels

    s = 1,  # Scale.
    p = 0.6 + 0j, # screen offset

    horizon = 2.0 ** 10,
    iterations=500
):

    s = int(s * n * 4 / 7) # maps scale factor to pixel space
    x = np.linspace(-n / s, n / s, num=n).reshape((1, n))
    y = np.linspace(-n / s, n / s, num=n).reshape((n, 1))

    Z = np.tile(x, (n, 1)) + 1j * np.tile(y, (1, n)) - p
    C = Z.copy()

    M = np.full((n, n), True, dtype=bool)
    N = np.zeros((n, n))

    for i in range(iterations):
        Z[M] = Z[M] * Z[M] + C[M]
        M[np.abs(Z) > horizon] = False
        N[M] = np.angle(Z[M]) + np.pi

    return N
N = create_mandlebrot_with_angles(n=2000)
fig = plt.figure(figsize=(20, 20))
ax = fig.add_axes([0, 0, 1, 1], frameon=False, aspect=1)
ax.set_xticks([]); ax.set_yticks([])
plt.imshow(np.flipud(N), cmap='magma');
N = create_mandlebrot_with_angles(n=2000, horizon=2, iterations=50)
fig = plt.figure(figsize=(20, 20))
ax = fig.add_axes([0, 0, 1, 1], frameon=False, aspect=1)
ax.set_xticks([]); ax.set_yticks([])
plt.imshow(np.flipud(N), cmap='magma');

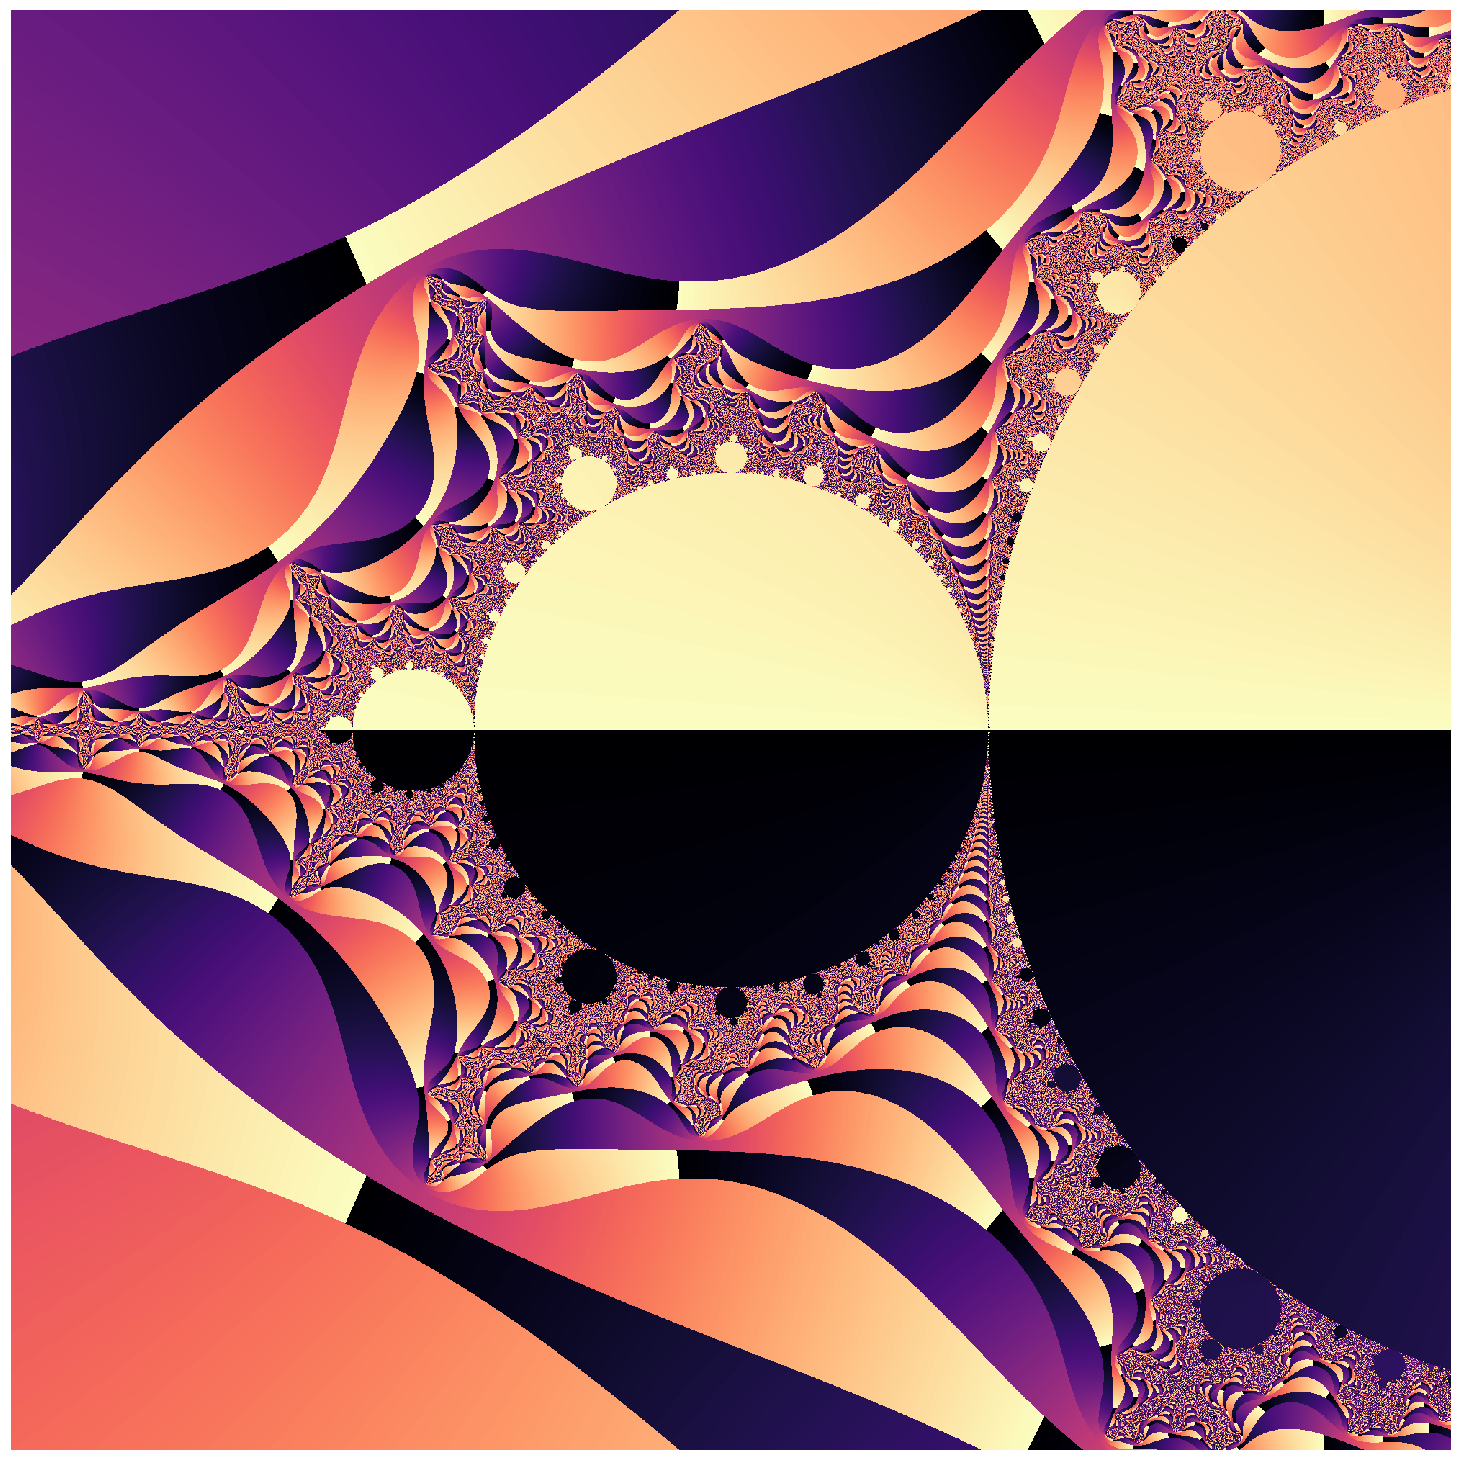
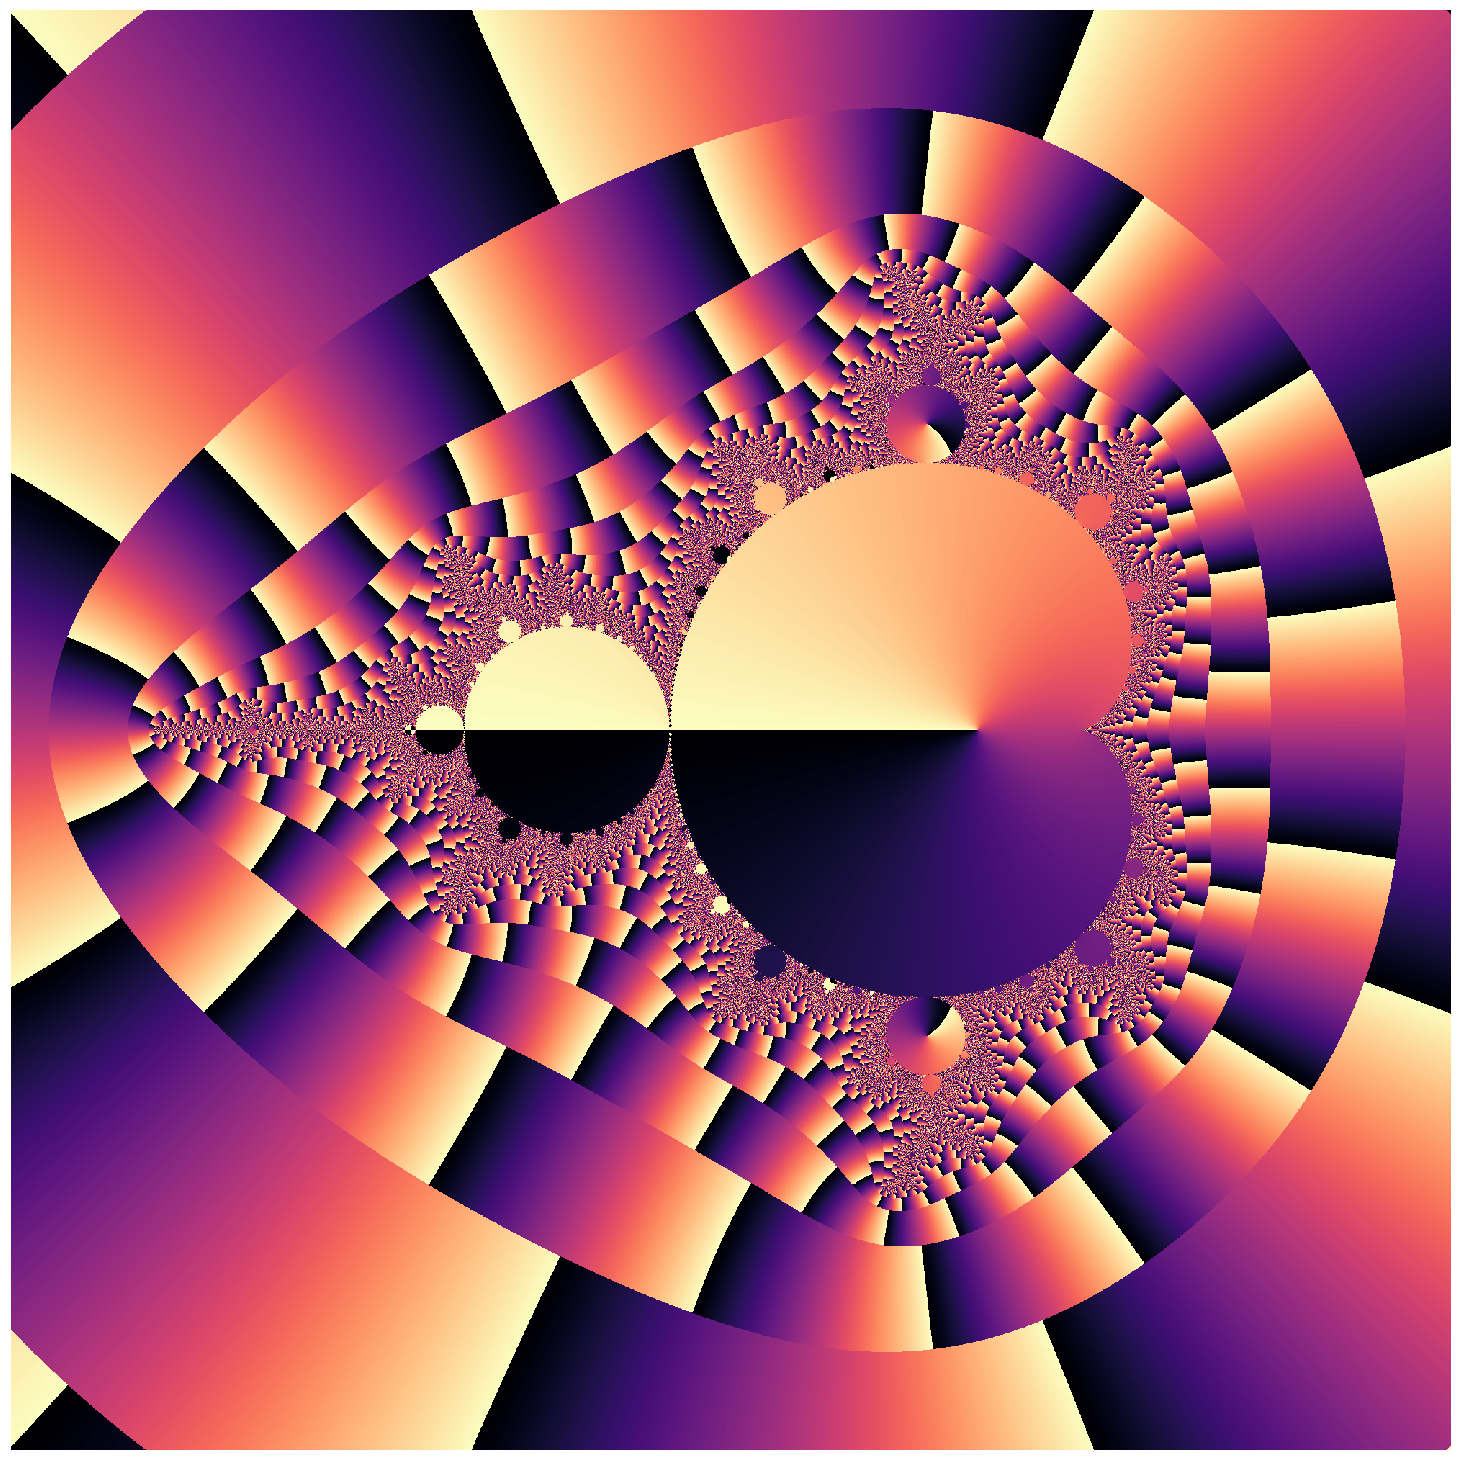
N = create_mandlebrot_with_angles(n=2000, horizon=2, iterations=2000, s=2.5, p=1+0j)
fig = plt.figure(figsize=(20, 20))
ax = fig.add_axes([0, 0, 1, 1], frameon=False, aspect=1)
ax.set_xticks([]); ax.set_yticks([])
plt.imshow(np.flipud(N), cmap='magma');